|
|
|
|
|
|
||||||

| Home | About Us | Sitemap |
|
|

|
|
|
|
Evoked potentials are small electrical events arising from neural tissue occurring in response to abrupt sensory stimulation. In current clinical application this usually involves stimulation of the visual, auditory, or somatosensory system. Evoked potentials were first described in 1875 by Richard Caton who recorded spontaneous electrical potentials from the cortex of animals and noted that the spontaneous (electroencephalographic) activity changed in response to visual stimulation. He also applied electrical stimuli to peripheral nerves and recorded "evoked" electrical potentials from appropriate cortical regions. Among the early discoveries about the human electroencephalogram (EEG) after Berger's 1929 report was that photic stimulation gives rise to small potentials in the occipital region (the driving response) and that potentials could be elicited by auditory stimulation during sleep (K-complexes). Subsequent work has shown that there are many types of responses to stimulation that are timelocked (i.e., have a fixed temporal relationship to the stimulus, however, most responses are too small to be distinguished from the ongoing EEG. An early approach to resolving the inherent signal-to-noise problem was reported by George Dawson in 1947. Responses to repetitive stimuli were displayed on an oscilloscope and superimposed on photographic film. Time-locked activity produced an overexposure in one area of the film as compared with random activity, which lightly exposed all of the film. The technique permitted the identification of low-amplitude potentials. time-locked to the stimuli. This superimposition is known as the overtrace method. Subsequently, the averaging of multiple responses by computer techniques facilitated the recording of evoked potentials: the larger random events of the ongoing activity are suppressed by the averaging process, and smaller evoked events that have a fixed temporal relationship to a stimulus are preserved. Availability of commercial systems has facilitated the recording of sensory evoked potentials in a wide variety of clinical situations.
Evoked potentials are principally useful in neurological practice for the evaluation of multiple sclerosis, which in its early stages often has symptoms and/or signs of one clinical lesion but one or more subclinical lesions that may be demonstrable by evoked potential techniques. Many degenerative disorders of the nervous system are associated with evoked potential abnormalities. Visual evoked potentials are often useful in ophthalmologic assessment, and brain stem auditory evoked responses provide an objective test of hearing in addition to their value in the detection of intrinsic or extrinsic lesions of the brain stem. Brain stem auditory and somatosensory evoked potentials are also useful in the assessment of coma and brain death. Some longlatency evoked potentials are reported to be helpful in the assessment of dementia and psychogenic disorders. Somatosensory evoked potentials have the capacity to evaluate both the peripheral and central nervous systems from the distal peripheral nerves to the sensory cortex. Responses derived from all modalities have been used in monitoring of operative procedures in which neural tissue is in jeopardy. In such monitoring, a stimulus is applied distally and responsive neural tissue is evaluated at a location proximal to the surgical procedure. The serial responses are evaluated continuously in reference to baseline values. Physiologic alteration resulting in evoked potential (EP) changes may warn of impending irreversible damage that may be averted by appropriate action.
Analog neural electrical activity is amplified, filtered, and converted to digital values for computation and storage. A trigger pulse is supplied by the stimulator or the computer triggers the stimulator to establish the time-locked relationship. Each epoch is stored and added to previously obtained digital values, and the sum is normalized by the number of stimuli presented. The average is then displayed on a screen, stored magnetically, and displayed on paper. The averaging process results in a marked improvement of the signal-to-noise ratio, in which the noise reduction factor can be estimated by calculating 1/√N, where N is the number of stimuli delivered to evoke the average. The number of individual responses required to form a noise-free average may vary from less than 10 to over 4000 depending on the relative amplitudes of the signal and noise. When the signal is large and the noise is small, few responses are required. Unfortunately, the opposite is more common, and more than 1000 stimuli may be needed.
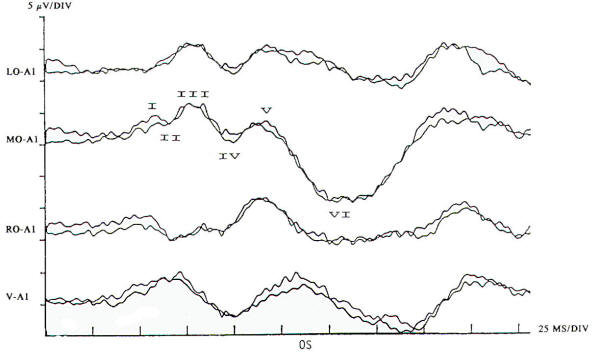
In the current practice of evoked potentials, stimulation of the visual system may be by flash or pattern (see below). Flash stimulation of the visual system affords a diffuse retinal stimulus, activating both the central and peripheral visual fields. Shifting checkerboard or grating patterns provide mainly macular stimulation, and the response is dependent on the integrity of the central visual field. Stimulation to elicit a visual evoked potential requires light with abrupt onset, such as a stroboscopic light or an array of lightemitting diodes (LEDs). Flash evoked responses (Fig-1) consist of a number of positive and negative peaks that vary greatly between individuals and are affected by subtle changes in the level of arousal and parameters of stimulation. This variability has limited their clinical utility. However, they are helpful in assessing patients whose visual acuity is too poor to generate evoked potentials to pattern reversal and in testing comatose patients and others unable to fixate on the pattern stimulus. Changes in the latencies and morphology of the responses have been used to follow the course of hydrocephalus both before and after shunting, with improvement in the flash evoked potentials. when shunting is successful and regression of the expected maturational change in the response if shunt failure occurs. The absence of a flash response is indicative of poor or absent visual function, and failure to record such responses in children usually indicates a poor prognosis for visual development.
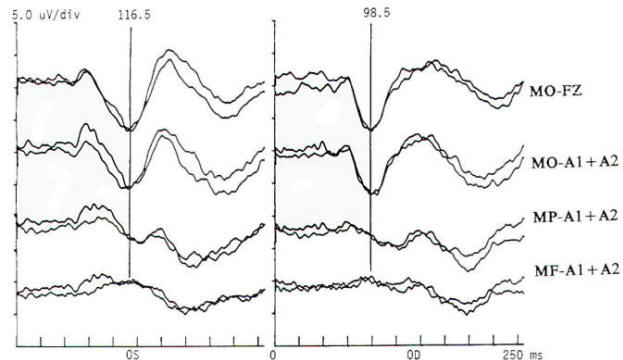
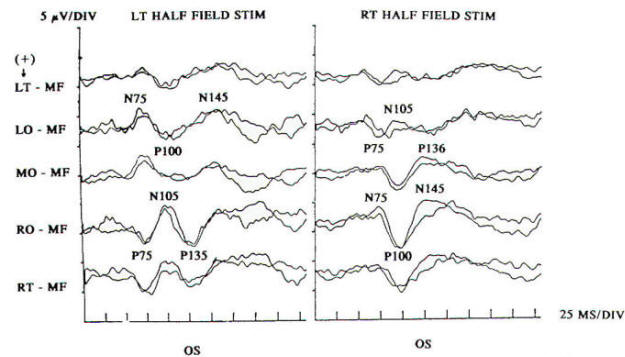
Pattern reversal techniques use several types of stimulators, all of which provide a checkerboard image. Stimulation occurs when the black (or colored) squares become white and vice versa. This is accomplished mechanically by pattern shift or electrically by pattern reversal. The patient is instructed to fixate on the shifting pattern. Recording electrodes are placed at scalp locations over the visual cortex. Prechiasmal disturbances can be detected by abnormalities of the response from a midline occipital electrode, with each eye being stimulated separately (Fig-2). Retrochiasmal lesions require multiple simultaneous recording channels with electrodes placed over lateral occipital and posterior temporal regions. The practical utility of evoked potentials in the assessment of retrochiasmal lesions is open to debate and requires a high level of patient cooperation (Fig-3).
Response latency and amplitude are sensitive to alteration of technical parameters and are affected by size and intensity of the checkerboard pattern, rate of stimulation, filter settings and head size. The major events of clinical interest occur within 200 ms in normal individuals. The analysis time is generally 250 ms and an artifact-free response may require 100 to 400 stimuli. Criteria for abnormality related to prechiasmal lesions are statistically based, primarily on the latency of the P100 component. Pattern reversal evoked responses have a consistent morphology. The latency of the principal positive component occurring at about 100 ms (P100) when subjected to statistical analysis yields a low standard deviation in the range of 2 to 4 ms. A normal pattern reversal response from right eye stimulation is shown in Fig-2; the negative components occur around 75 and 145 ms. and are therefore called N75 and N145. With prechiasmal lesions, abnormalities of pattern reversal responses consist primarily of a unilateral or bilateral prolongation in latency of the P100 component, or an asymmetry in latency of the P100 between the eyes exceeding statistical norms. This is usually defined as the mean plus three standard deviations. A better statistical criterion is the tolerance limit (TL), in which the 99 percent TL is calculated from a sample of the normal population. Although often present, amplitude changes can be affected by non neurological factors, including simple errors of refraction. Evoked potential latency prolongation is often seen in multiple sclerosis and may be present bilaterally when symptoms are unilateral or even when the patient is visually asymptomatic. The predilection of multiple sclerosis for the optic nerve is well known: autopsy series have suggested that as many as 90 percent of multiple sclerosis (MS) patients may have demyelination of the optic nerves even though there may have been no visual symptoms during life. Evoked potential (EP) testing reveals almost the same incidence of abnormality in end-stage MS. An acute attack of optic neuritis may not be associated with any discernible abnormality of the eye on clinical examination, and visual acuity not uncommonly returns to normal, although an enlargement of the central blind spot, pallor of the optic disc, or impairment of color perception may be detectable. Early investigators reported that 100 percent of MS patients who had had optic neuritis showed prolongation of response latencies, even if they no longer had disturbances of visual acuity or fields. Although the actual figure may not be this high, it probably exceeds 90 percent. Moreover, it is estimated that less than 5 percent of abnormal responses subsequently return to the normal range. Approximately 60 percent of patients with MS have response abnormalities despite no history or findings of optic nerve involvement. Thus, visual evoked potentials are a useful diagnostic tool for detecting additional lesions of MS that are not evident clinically and for confirming that subjective complaints of visual disturbance are in fact due to organic visual dysfunction. Compressive or destructive lesions in or around the optic nerve may prolong response latencies, but they are more likely to attenuate amplitude or distort morphology. Prominent changes are caused by a glioma of the optic nerve. Such lesions are not uncommon in children, and occur less frequently in adults. They are often subtle in their clinical presentation and may present as visual complaints of possibly functional character. Diseases of the eye or optic nerve that primarily affect visual acuity will also cause diminution of response amplitudes.
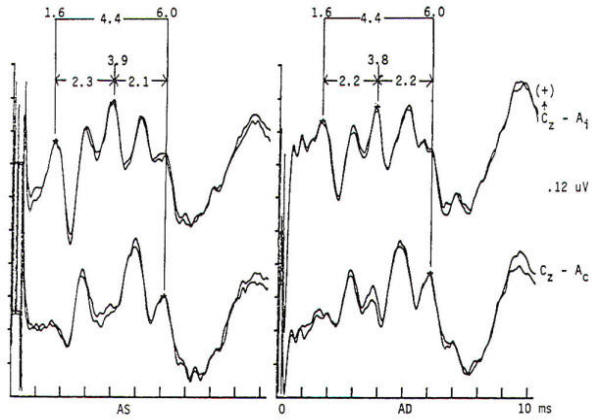
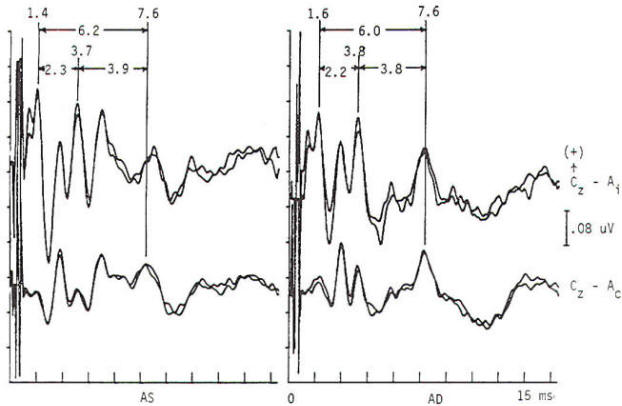
Potentials evoked by stimulation of the auditory system of normal persons develop within 2 ms after the stimulus with a cochlear microphonic and subsequent compound action potential from the auditory nerve. The later components are generally larger in amplitude and more variable in morphology. All the components occurring within the first 7 to 9 ms are of brain stem origin and are recorded as far-field events with the exception of wave I. Middle-latency auditory evoked potentials (20 to 100 ms) may arise in the brain stem and thalamus, while the frontal and temporal lobes, particularly the hippocampus, have been implicated in the generation of long-latency (> 100 ms) auditory evoked potentials. Click stimulation is supplied to the auditory system through headphones, generally unilaterally and with white noise masking of the contralateral ear. The electrical impulse is a square wave of very brief (100 µs) duration. The oscillations it creates in the headphone contain a broad frequency spectrum with the major energy in the 3- to 4-kHz range. The latency of the responses are directly influenced by the intensity of the click. The clicks are generated by inward or outward movement of the headphone diaphragm with respect to the tympanic membrane, and may have one of two polarities: rarefaction (R), in which the headphone diaphragm initial movement is away from the tympanic membrane, and condensation (C), in which movement is toward the tympanic membrane. An alternating polarity that is an interleaved mixture of the above R and C clicks is also employed. Short-latency auditory evoked potentials are now widely used in neurology and audiology. Seven components may be recorded within the first 10 ms and are designated by Roman numerals I through VII. Only waves I, III, and V are considered mandatory (obligate) for determination of normalcy. Waves II, IV, VI. and VII may be absent in normal individuals. Wave I is a nerve action potential of the acoustic nerve, wave III is of lower pontine generation, and wave V is thought by the majority of workers in the field to have lower midbrain generation (Fig-4). These are probably ipsilateral responses of white-matter tracts, rather than the nuclear responses initially proposed. Waves II, IV, VI. and VII are more variable in terms of their morphology; waves IV and V may be fused; and waves I and III may have more than one peak. With the exception of wave I. these are far-field responses, generated in the brain stem but recorded at the scalp; wave I is near field, recorded by the ear or mastoid electrode and generated by the peripheral nervous system. A brief 100-µs rectangular pulse delivered to headphones generates a click stimulus having a broad frequency range from 300 to 6000 Hz. Clicks are generally delivered at rates of 10 to 80/s. Faster rates of stimulation prolong both absolute and interpeak latencies. Recordings are usually made from a vertex-to-ear or -mastoid derivation. Analysis time is 10 ms, and as many as 4000 stimuli may be required to obtain an artifactfree response. These responses are influenced by a number of nonpathologic factors. Lower stimulus intensities and more rapid rates of click presentation produce longer absolute latencies. Females have shorter latencies than males. Latencies lengthen with increasing age and decreasing brain temperature, and are prolonged in neonates, decreasing to adult values by 2 years of age. Latencies are also influenced by the acoustic phase of the click stimulus. Normality or abnormality is determined by the presence or absence of waves I, III or V. and by the interpeak latencies between them as compared with statistical norms.
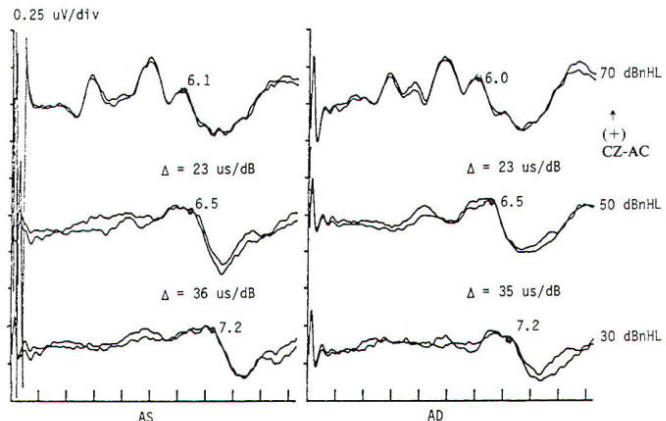
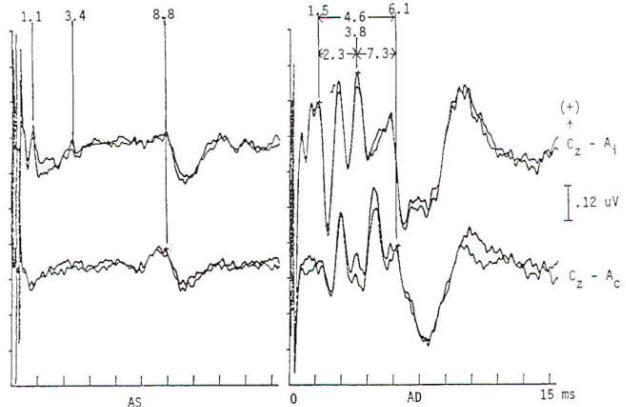
Brain stem response audiometry is a technique of evaluating end-organ function in patients who cannot participate in behavioral testing (comatose patients and neonates). This is generally done by determining the wave V latency as a function of stimulus intensity (Fig-5). Relatively distinct patterns of response are produced by patients suffering conductive as opposed to sensorineural dysfunction. Deafness of functional origin is associated with normal responses, as is deafness produced by bilateral lesions of the auditory cortex. Generally one cannot prove organic deafness on the basis of abnormal or absent responses, although it is often implied. In multiple sclerosis and some posterior fossa structural lesions, however, unilaterally absent responses may be encountered in patients who have no audiologically detectable hearing deficit. Although magnetic resonance imaging is now widely used in the diagnosis of multiple sclerosis, auditory evoked potentials are useful in patients with negative imaging studies and/or clinical examination. A sizable minority (20 to 40 percent) of MS patients have brain stem auditory evoked potential (BAEP) abnormalities, including patients without symptoms or signs of brain stem dysfunction. Thus, as in visual EPs, the test may provide physiologic evidence of areas of involvement that are silent clinically. This may take the form of complete or partial absence of waveforms, relative attenuation of wave V or prolonged interpeak latencies (Fig-6). In a Mayo Clinic study; a significant number of patients with brain stem evoked potential abnormalities at the initial presentation, when only a single neurological lesion was suggested clinically, developed clinically definite MS within the next 3 years. Response abnormalities of similar character are also seen in other demyelinating diseases. Chief among these are the leukodystrophies of childhood, which are generally hereditary and involve developmental disturbance, motor dysfunction and central pontine myelinolysis.
Intrinsic or extrinsic tumors of the brain stem may present clinically with various combinations of cranial nerve, motor tract, and sensory pathway dysfunction, although a functional diagnosis is often entertained until the neurological findings become blatant. EP abnormalities develop early in both intrinsic and extrinsic brain stem tumors. A wide variety of abnormalities may be produced by slowly progressive extrinsic tumors, of which acoustic neuroma is the best example (Fig-7). Such abnormalities may not only involve prolongation of interpeak latencies or attenuation of responses on the side of the tumor, but may also include abnormalities on the opposite side because of brain stem compression from the neoplasm. Evoked potential monitoring has been found helpful during surgical resection of such tumors, in which the facial and acoustic nerves may be damaged. Changes in evoked potentials have been associated with intraoperative compromise of acoustic nerve function, while identification of the facial nerve by electrophysiologic techniques may help to avoid its sacrifice. Another major area of utility is the evaluation of coma. In patients unconscious as a result of bilateral cerebral cortical dysfunction, and in other diseases diffusely involving the cerebral cortex such as Alzheimer's disease, responses are generally normal. The same is true of psychogenic coma. In coma due to bilateral damage of brain stem structures, abnormality or absence of responses indicates a poor prognosis. Brain stem auditory evoked potentials are resistant to generalized seizures and anesthesia, and normal responses can be recorded when the EEG is isoelectric, even when the patient otherwise meets clinical criteria of brain death. Thus, preservation of BAEP in a patient with coma, apnea, areflexia and flat EEG may suggest an overdose if the history is not known when the patient presents in coma. Alternately, profoundly abnormal or absent responses support an impression of irreversible brain insult. In both head-injured patients and those subjected to ischemia or anoxia, inability to record brain stem auditory evoked potentials is correlated with a poor outcome: however, one must be cautious in interpreting such data, as the patient may have preexisting audiologic disease. Prolonged deep barbiturate anesthesia is utilized in some centers in the treatment of severe cerebral trauma. BAEPs have been used to monitor such patients, as they may be the only evidence of preserved neural function because vital signs may be suppressed by the anesthetic agents. Long-latency evoked potentials may be elicited by auditory, visual, or somatosensory modalities and may even be "evoked" by the absence of stereotypical events. As a class they are often referred to as cognitive potentials or event-related potentials. They are alleged to be capable of assessing cognitive function and enable the study of neuropsychiatric disorders. The best-known and most widely used, the P300 wave, is elicited by auditory stimulation and has been reported to show prolongation or attenuation in dementia as compared to the pseudodementia that often accompanies major depression. Changes in complex partial as opposed to generalized epilepsy have been described and P300 abnormalities have been found in patients with parkinsonism and related disorders who have early dementia. Preservation of P300 with possible improved prognostic implications after major traumatic brain injury has been reported, while P300 latency increases after minor head trauma have supported the view of an organic origin of some cases of postconcussive syndrome.
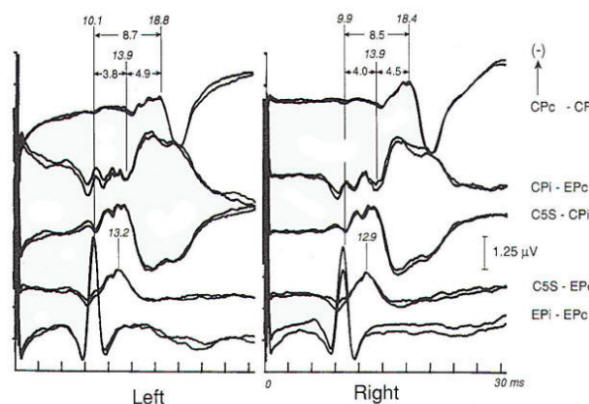
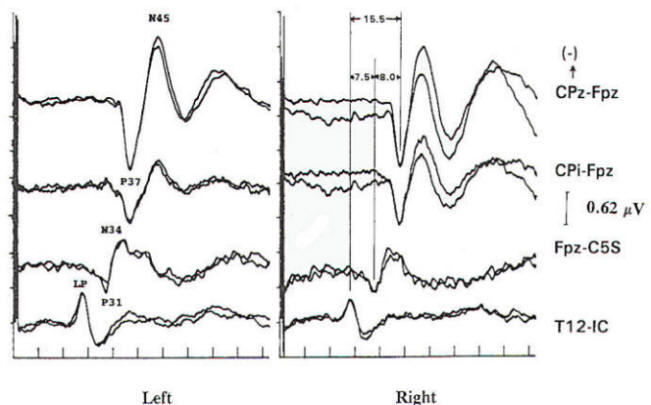
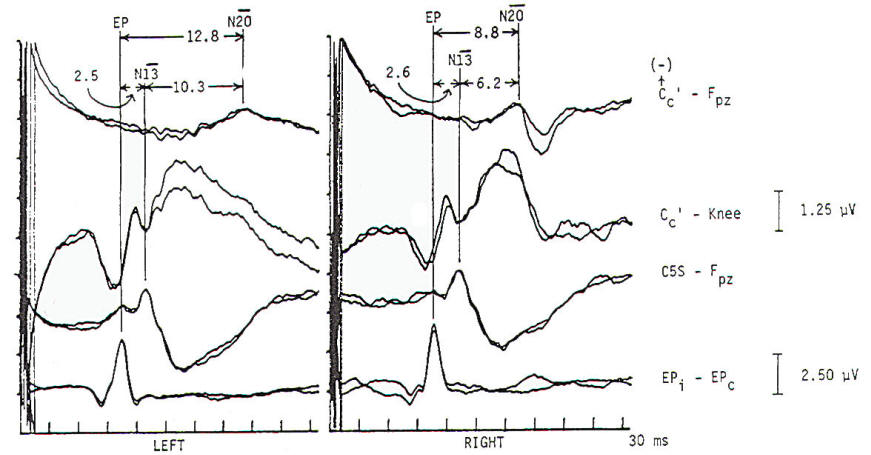
Stimulation to produce a somatosensory evoked response is usually electrical and is applied transcutaneously to a peripheral nerve, the amount of current being the level required to produce a clearly visible muscle twitch. Although intensity-dependent changes in the response are present at stimulus levels below motor threshold, there is little change in amplitude or latency of the response once the stimulus is above motor twitch threshold. Electrical stimulation of dermatomes has been reported, which has the advantage of specific root evaluation. Seyal et al. reported on the use of segmental spinal EP responses in the study of lumbosacral root disease. Responses from surface electrodes over the lower spine were obtained in response to lower extremity peripheral nerve stimulation. Nerves with limited root access to the central nervous system (CNS) were used. In only a minority of patients is useful additional information gained that is not known from clinical imaging and electromyographic data. The required EP techniques are difficult and time consuming. Inadequate data are obtained when scalp responses to either dermatomal or segmental stimulation is used. Excessive false-positive and -negative interpretations were the result of using scalp recorded data. Finally, direct stimulation of descending motor pathways during surgery and transcortical magnetic stimulation of the motor cortex may have some value in intraoperative assessment of spinal cord function and study of motor pathways. Electrical stimulation, which is the most common clinical procedure, produces ascending volleys up both motor and sensory pathways in peripheral nerves. This action potential can be easily recorded by surface electrodes overlying the nerve at various locations. These peripheral action potentials are subject to a variety of unwanted variables, such as age, temperature, limb length and interindividual variation. Stimulation of nerves at the wrist (median or ulnar nerve) or ankle (posterior tibial nerve) elicits peripheral and CNS responses .Fig-8 and 9). CNS responses may be generated from the spinal cord, brain stem, and cortex. The variability induced by peripheral factors mentioned above is minimized if not eliminated by determining the latency of the response just prior to entry into the CNS and calculating the interpeak latencies from this peripheral response to later, more rostrally generated responses. Such interpeak latencies indicate the central transmission time and provide the major criteria for normalcy of a somatosensory study. The peripheral response from Erbs point (brachial plexus) or lower spinal (cauda equina) electrodes is analogous to wave I (auditory nerve I of the BAEP (Fig-8). The remaining components are a mixture of near- and far-field events.
The conduction velocity from the stimulated wrist (median nerve) to the brachial plexus (or lower extremity analogue) can and should be calculated, although because of its long length it is relatively insensitive to change caused by the acquired peripheral neuropathies, which primarily involve distal regions. Conduction changes caused by the various congenital and acquired neuropathies are readily detected and often present as an unexpected finding in clinically asymptomatic individuals.
Several concepts are helpful to understand the neurophysiologic assumption underlying many of the assignments of generator origin. Although near- and far-field components are present in the visual and auditory systems, it is in the somatosensory system that some understanding of the concepts is particularly important for clinical interpretation. Near-field components are those waveforms arising from neural tissue close to the recording electrode. Such responses are relatively large, are slow in both frequency and latency. and show marked variation in morphology as recorded from different locations over the scalp (topographic specificity). In contrast, a far-field response is considered to be generated by subcortical structures, distant from the recording electrodes. In biological systems, far-field responses are relatively small (submicrovolt) and are faster in both frequency and latency, in addition to showing relative topographic nonspecificity across the scalp with nearly identical morphologies at widely separate locations. It is often this latter feature that is the most striking, such that even quite large components may be isopotential and cause cancellation in scalpscalp derivations. The following is a discussion of obligate components seen in response to stimulation of major compound nerves of upper and lower extremities. Their neural origin is discussed. Responses to Upper Extremity Stimulation. Erb's point: The Erbs point response is a peripheral nerve action potential recorded from the brachial plexus. It has a triphasic positive-negative-positive waveform characteristic of any peripheral nerve action potential. With a conduction velocity of 50 to 60 m/s the nerve volley travels from wrist (median. radial, or ulnar nerve) to the recording site at Erb's point. Spinal N13-P13 (near-field) These potentials are best investigated by the use of electrodes on the posterior cervical region in conjunction with electrodes on the anterior neck or in the esophagus. This is a local potential with a horizontal dipole, negative posteriorly and positive anteriorly, which is thought by Desmedt to be due to a segmental generator, probably in the dorsal horns. This potential can be observed in certain lesions that interrupt the dorsal column pathways and obliterate the other positive far-field potentials recorded at the scalp. Lueders et al. point out that N12 (probably equivalent to N13 of Desmedt) "most probably corresponds to the postsynaptic dorsal cord potential." P13 and P14: These two components probably represent lemniscal activity. Desmedt and coworkers believe their onset relates to activity in the caudal most lemniscal fibers, and the peak of P14 corresponds to arrival of the volley at the thalamus. These far-field potentials are seen in a cephalic-noncephalic reference and are not recorded below the level of the foramen magnum. Some authors have attributed them to activity in dorsal column nuclei but because of the closed electrical fields generated in nuclear masses, this seems less likely to many investigators. The interpretation of these potentials as arising in lemniscal pathways would fit with an estimated conduction velocity of these pathways of 58 m/s and including a synaptic delay of 0.4 ms in the dorsal column nuclei. Further, P14 is preserved in patients with thalamic lesions that abolish subsequent scalp-scalp components following stimulation of the contralateral limb. There has always been some controversy about the origin of these waves, however, Lueders and coworkers suggest that P13 originates in ipsilateral dorsal column pathways at the level of the cervicomedullary junction. They thought that this far-field potential was due to the abrupt change in current flow produced when the afferent volley enters the skull. N18: This is a negative potential that begins as early as 16 ms after the stimulus, and persists for 6 ms or more. It is a far-field potential (anomalous in that most far-field potentials are positive and of higher frequency), recorded widely throughout the scalp. It is preserved after thalamic lesions and is thought to arise in the brain stem. A similar potential was recorded by a depth electrode implanted in the fourth ventricle by Hashimoto. It is noted the persistence of this potential in patients who suffered a rightsided pontine stroke, even though near-field, scalp-scalp potentials from that side were obliterated. This potential probably arises from collateral or reverberating circuits in the rhombencephalon. N20: This potential is thought to arise from the posterior bank of the central fissure contralateral to the stimulated limb. This is a near-field potential, typically recorded in scalp-scalp derivations. For some time it was thought that N20 was simply the negative end of a dipole, the positive end of which was the P22 or other variously named positive waves noted below. Desmedt and others have argued that this notion is untenable. P22: This wave is also generated in cortical structures, but is more widespread, seen throughout the frontal cortex bilaterally. It peaks 1 or 2 ms later than the more localized parietal negativity (N20) noted above, and may arise from a direct connection between the thalamus and the prerolandic cortex. Later Potentials: Later potentials are well known, and include P27, N30, and P45. They are clearly state dependent. The generators of many later potentials are usually attributed to activity in cortical association areas. Responses to Lower Extremity Stimulation Popliteal Fossa (PF) Potential: The PF potential is a triphasic compound nerve action potential recorded in response to tibial nerve stimulation. It is obtained by recording the ascending volley in the popliteal fossa by bipolar or referential derivations. The latency is directly dependent on peripheral nerve conduction velocity and limb length. Because of the difficulty of recording spinal responses in some patients, the PF potential is often used to calculate an interpeak latency to later subcortical and cortical arising potentials. Such interpeak latencies have smaller variance and therefore greater clinical utility than the absolute latencies of scalp potentials (P37, N45 ). Lumbar Potentials (LP): In derivations using a recording electrode over the lumbar spine and a distant reference electrode (the iliac crest, umbilicus, high thoracic), a biphasic wave is recorded, usually with an absolute latency in the range of 18 to 25 ms following stimulation of the tibial nerve at the ankle. The potential is composed primarily of a stationary component that is maximal in amplitude at the level of the T12 vertebra. The latency does not change when recorded from electrodes above and below T12 but the amplitude is reduced. The component has a dipole configuration with negativity projected anteriorly. A small traveling wave of dorsal column origin can be detected and traced when sequential spinal electrodes at multiple sites are used. This potential is frequently used as a reference for measurements of central conduction in the spinal pathways. The EP guidelines of the American Electroencephalographic Society refer to this potential as the lumbar potential (LP) and suggest a derivation from the T12 vertebra referenced to the iliac crest (T12S-IC). Subcortically Originating Potentials: Desmedt and Cheron have recorded a positive potential in scalp-noncephalic derivations that they term the P17, attributed to the peripheral nerve volley as it enters the sacral plexus at the upper buttock. This may be analogous to the P9 recorded after median nerve stimulation. A P21 component noted by Desmedt and Cheron is attributed to ascending dorsal column activity. They think that this is the far-field representation of the local N21, the near-field dorsal column volley. Lueders et al. identify a P27 that they attribute to dorsal column activity as it "enters the skull at the level of the foramen magnum and is therefore equivalent to PI3. Other authors recognize a positive far-field potential occurring at about 30 ms absolute latency after tibial nerve stimulation. Lemniscal activity seems to be one of several likely candidates for generation of this potential. In scalp-noncephalic derivations such as FPz-C5S, one may avoid the superimposed cortical response by selecting an electrode site out of the field of the cortical response (see below) and record far-field components in isolation. A P31, analogous to the median nerve somatosensory evoked potential (MN-SSEP) P13, and N34, analogous to the MN-SSEP N18, are the most notable. Apparently because of their subthalamic origin they are far less influenced by inhalational anesthetic agents and therefore are often used during intraoperative monitoring. Cortically Originating Potentials: The major cortical response is a positive wave termed P38 by Desmedt and Bourguet. P37 by Chiappa and Ropper. This wave undoubtedly represents the cortical generator in the leg-receiving area at the edge of the interhemispheric fissure. It is often of highest amplitude a centimeter or two lateral to the midline, ipsilateral to the side of stimulation. This paradoxical lateralization is proposed to be due to a dipole projection. The hemisphere contralateral to the stimulated limb generates the response: however, the positive component of the dipole projects to the opposite scalp area. Subsequent potentials (N49. P57. N75. etc.) are similar to later potentials discussed under median nerve stimulation, are of uncertain generator source. Usually the later the latency of the peak or valley. the greater the variability. This is true not only of morphology and latency but also of symmetry, as easily demonstrated by poor reproducibility. Later components are affected by alcohol, sedatives. tranquilizers, and analgesics as well as level of arousal and psychological factors. It is this latter fact that makes the later components of interest to the physiological psychiatrists and psychologists but limits their value in neurological diagnosis. Abnormality in these later components is usually produced by cortical disease, and other diagnostic procedures such as electroencephalography and imaging studies are usually of greater diagnostic value. Following median nerve stimulation, the Erbs point to N20 latency is calculated as the overall central conduction time from brachial plexus to primary sensory cortex. If this value is prolonged as compared with normative data, further analysis is required to determine if the prolongation is due to the more caudal Erbs point to P14 segment or the more rostral P14 to N20 (Fig-10). In severe lesions components may be entirely missing or grossly attenuated and altered in morphology.
Numerous reports indicate that the somatosensory evoked potentials are similar to visual and auditory responses in the sense that they are sensitive to subclinical lesions. Evidence to support this contention may be found in the many cases of acute trauma with clear neurological signs of deficit that resolve with time but leave subclinical physiologic residuals detectable by the abovedescribed techniques. Somatosensory testing is reported to be essentially equal to visual EPs in the detection of occult lesions in MS and to have a higher incidence of abnormality than auditory brain stem responses in patients suspect for demyelinating disorders. The clinical utility of SSEPs is similar to that of auditory and visual EPs with some important additions. In MS, somatosensory responses are equally sensitive for the identification of occult lesions as compared to pattern reversal visual EPs and more sensitive than auditory brain stem responses. Neoplasia of the spinal cord and brain stem usually produces major disturbances. Although rarely necessary in the evaluation of brain death, somatosensory evoked potentials have a certain advantage over BAEPs because the stimulus has direct access to the nervous system rather than being transduced by the cochlea, which may be defective for many reasons. Obviously, this form of stimulation is at least theoretically capable of evaluating both the peripheral and central nervous systems from toe to cortex (excluding the spinothalamic pathways). Peripheral neuropathies may be detected. Useful information may be obtained in patients suffering traumatic brachial plexopathies in which the degree of root involvement is unknown. Amyotrophic lateral sclerosis was initially thought to have no effect on sensory EPs but it is now recognized that lower extremity SSEPs may be abnormal in 40 percent of such patients. The use of SSEPs in evaluating basic mechanisms of spinal cord and nerve transmission, as well as response to therapy, has been well demonstrated.
|
|
|
|||||||||||||||||||||||||||||||||||||||||||||||||||
|
|
|
|
|